
Last weekend I went to have my head examined. Scanned, actually.
In partnership with the Canadian clothing outlet Simons, artist Douglas Coupland has kicked off a seven-city, four-year project called “#3D Canada: A portrait of Canadians in the 21st century.”
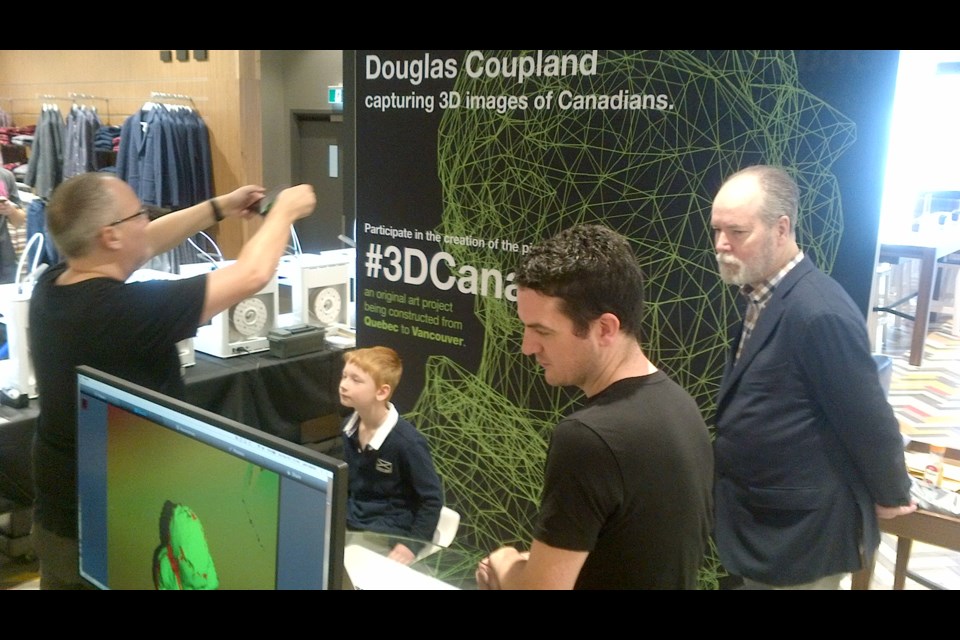
“Come and have your image scanned to take home your very own unique 3D-printed bust,” a newspaper ad beckoned. This caught the attention of both the tech-watcher and narcissist in me. So on Sunday I joined a lineup of like-minded scan subjects at Park Royal mall.
A woman behind me had optimistically brought her spaniel/poodle cross along in a crate. An accurate rendering requires subjects to sit still for 30 seconds; hopefully the 3D portrait of her fidgety pet didn’t end up looking like something from a Guillermo del Toro film.
CEO Peter Simons says Coupland is keeping mum on details of his 3D project, adding that he’s quite satisfied to remain in suspense until the artist unveils the final results.
Needless to say, the pop artist isn’t about to spill the beans to me, either. “If you were to describe the future of 3D printing in one word, what would that be?” I asked while sitting for my scan, soliciting the shortest arts interview in Canadian history. “Inevitable,” Coupland helpfully replied.
No denying that — 3D printing is already revolutionizing medical implants and prosthetics, to name just one area of impact. (Startup company Natural Machines has a “Foodini” that prints out pizza that “looks surprisingly appetizing,” according to cnet.com.)
Your cellphone contains more processing power than president Eisenhower had at his command in a Pentagon situation room. In time you’ll probably be using it to download templates to your home 3D printer.
“Seen the wine opener around, Doreen?” “Oh for God’s sake, just print one out, Mitch.”
Perhaps even hard-copy publishing will become a literal cottage industry. Speaking of books, one of the larger ones on my shelves is Information Graphics, a spleen-squishing compendium of charts and graphs from the heavyweight art publisher Taschen. The 2012 tome is so big it comes with a pullout infographic map for navigating its own contents. Suck on that, Kindle.
“Our everyday lives are filled with a massive flow of information that we must interpret in order to understand the world we live in,” reads the book’s sleeve. “Considering this complex variety of data floating around us, sometimes the best — or even only — way to communicate is visually.”
Infographics is the art and science of displaying data in a comprehensible — and even beautiful — way. Whoever would have thought cold, hard numbers could be woven into such clever tapestries and sculptural forms?
Fast processing, sophisticated software, and massively farmed data have made infographics a game any good professional designer can play. And there’s enough of the 2D variety in the Taschen book — culled from sources in advertising, academia, media, government, and NGOs — to absorb a geek for a week.
For example, “Everyone Ever in the World” depicts all recorded conflicts in history and their impact on populations. “The total number of people ever born is an estimated 77.6 billion and is represented as the total poster area. The total number of people killed in conflicts is approximately 969,000,000 or 1.25 per cent of all people ever to have lived.” The resulting chart looks like a black vinyl record with a die-cut hole in the centre, representing the fraction who died in wars.
Many charts in the book are more whimsical. One example is a “Rock n’ Roll Metro Map” that arranges the most influential genres of rock music to resemble the famous map of the London Underground.
Some are in a category all their own, such as “The Corporate Vermin That Rules America,” a chart from 2003 that depicts the Bush administration (Rumsfeld, Cheney, et al and their associated firms) as a halo of bugs around the 42nd president, who is rendered as an ape.
If a picture is worth a thousand words, it’s time for me to shut up and for you to reserve the one copy of Information Graphics available at VPL.
As for my shrunken head, I’m told it will be ready for me to pick up at Simons later in the week. I’m hoping this infographic knickknack will work well as a conversation-stopping keychain pendant.
geoffolson.com
@geoffolson


