
It won’t come as a surprise to many Vancouverites that renters are spending too much of their income on housing, nor will it come as a shock that rental housing costs are climbing faster than incomes.
But that was confirmed by the 2018 Canadian Rental Housing Index, a comprehensive database of rental housing statistics released May 8 by a national partnership of housing associations, credit unions, and municipal associations.
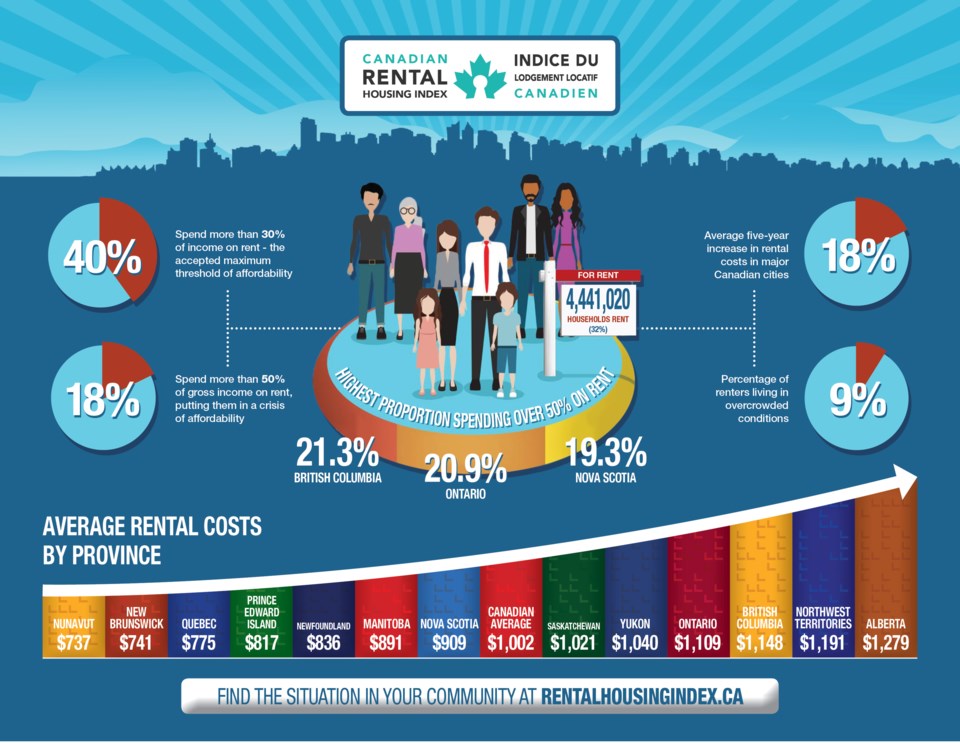
Nationally, according to the index, 40 per cent of renter households spend more than 30 per cent of their gross household income on rent, while 18 per cent spend more than 50 per cent. Thirty per cent is generally accepted as the threshold of affordability.
In Vancouver, close to half — 44 per cent — are spending more than 30 per cent of their income on rent and utilities, while one in four Vancouver households are spending 50 per cent, which is considered a critical level of overspending. The information also revealed that more than 417,000 renter households in Canada are considered overcrowded.
“What this data is showing is that really it is now becoming the new normal,” said Jill Atkey, acting CEO of the BC Non-Profit Housing Association. She added that spending 50 per cent is "putting those individuals and families at risk of homelessness."
"They’re going without other basic necessities like groceries, transportation and childcare. Certainly, anything like music and soccer classes for the kids are out of the question at that point when you’ve got that critical level of overspending.”
The index was developed using the latest census data from Statistics Canada and it tracks everything, from average rental costs to how rental housing spending compares with income to overcrowding for more than 800 cities and regions, through a web portal. The tool is designed for governments, local planners, housing organizations and the general public to view an accurate picture of the rental housing market in communities across the country.
Atkey said when it was first developed four years ago, most of the focus of the conversation around affordability was on home ownership.
“We couldn’t have told you at that point what are incomes of earners, how much they were spending on rent, how different communities were stacking up against each other or whether the renters were living in suitable conditions,” she said. “And, we certainly couldn’t have told you that in a uniform sense across the country using these same comparators. What we saw, when we released the index, is it really shifted the conversation around affordability and to get the public thinking about renters.”
In fact, more than a third of Canadians and a third of British Columbians rent. The public and all levels of government are beginning to pay attention to them, according to Atkins.
“Three years ago, we had no national housing strategy, the province [of B.C.] wasn’t making significant investments in affordable housing as they are today. The municipalities weren’t identifying that they, themselves, had a role,” she said. “We’ve also been educating our membership, so non-profit and co-op housing providers say, ‘Wait, this isn’t just a government problem alone to fix. We have a role to play.’”
While it can take a few years for the average renter to see the impact of investments in housing, Atkins said British Columbia, and Vancouver, are turning a corner.
“It’s cold comfort to the renter experiencing challenges today but, for example, in the city of Vancouver, we had the announcement last week of 1,000 new units being built in the next two to four years in the non-profit and co-op sector. Those types of announcements are happening more and more frequently, so the data that we released today is really supporting the need for those continued investments.”
More information about the index can be found here.
Data on rental households in Canada provided by the 2018 Canadian Rental Housing Index
Nationally:
- 40 per cent of renter households spend more than 30 per cent of gross household income on rent
- 18 per cent of renter households spend more than 50 per cent
- average rent: $1,002
- 25 per cent of all renter households make less than $20,000 per year.
Top 5 provinces/territories with the highest average rent:
- Alberta ($1,279)
- Northwest Territories ($1,191)
- British Columbia ($1,148)
- Ontario ($1,109)
- Yukon ($1,040)
Top 5 provinces/territories with the highest share spending more than 50 per cent of income on rent:
- British Columbia (21.3 per cent)
- Ontario (20.9 per cent)
- Nova Scotia (19.3 per cent)
- Newfoundland/Labrador (17.1 per cent)
- Saskatchewan (16.4 per cent)
Top 5 provinces/territories with the highest share spending more than 30 per cent of income on rent:
- Ontario (45.7 per cent)
- British Columbia (43.3 per cent)
- Nova Scotia (42.8 per cent)
- Saskatchewan (42.1 per cent)
- Newfoundland/Labrador (39.4 per cent)
Top 5 municipalities with the highest average rent:
- Wood Buffalo (Fort McMurray), AB.: $1,805
- Whistler, B.C.: $1,655
- Rocky View, AB: $1,626
- Yellowknife, NWT: $1,613
- Airdrie, AB.: $1,597
Top 5 municipalities with the highest share spending more than 50 per cent of income on rent:
- West Vancouver, B.C. (37 per cent)
- Richmond Hill, Ont. (32 per cent)
- Vaughan, Ont. (29 per cent)
- Sechelt, B.C. (29 per cent)
- Markham, Ont. (29 per cent)
Top 5 urban centres (100,000 people or over) with the highest share spending more than 50 per cent of income on rent:
- Greater Toronto, Ont. (23 per cent)
- Greater Vancouver, B.C. (22 per cent)
- Ottawa, Ont. (20 per cent)
- Montreal, Que. (18 per cent)
- Edmonton, AB. (17 per cent)
noconnor@vancourier.com
@naoibh


