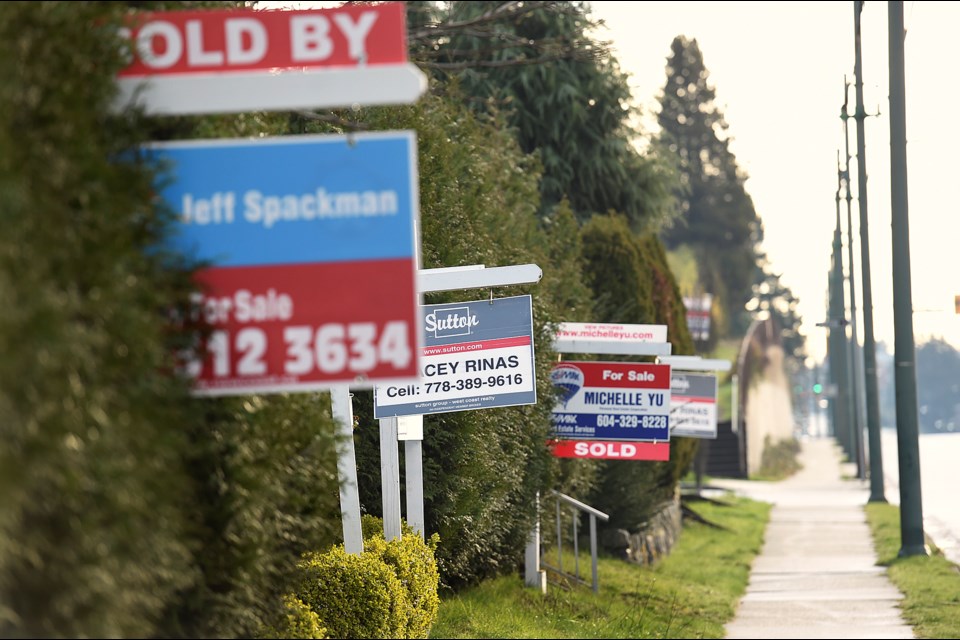
The average price of a detached house in Greater Vancouver will decline 21 per cent from its recent peak to $1.5 million by 2019 and will stay at that level until a recovery begins in late 2021, according to a forecast based on historical trading patterns.
“Sell now and begin buying again in four to five years,” is the advice from Dane Eitel, a North Shore realtor who has applied the discipline of technical charting used in the equity market to forecast Greater Vancouver’s housing market.
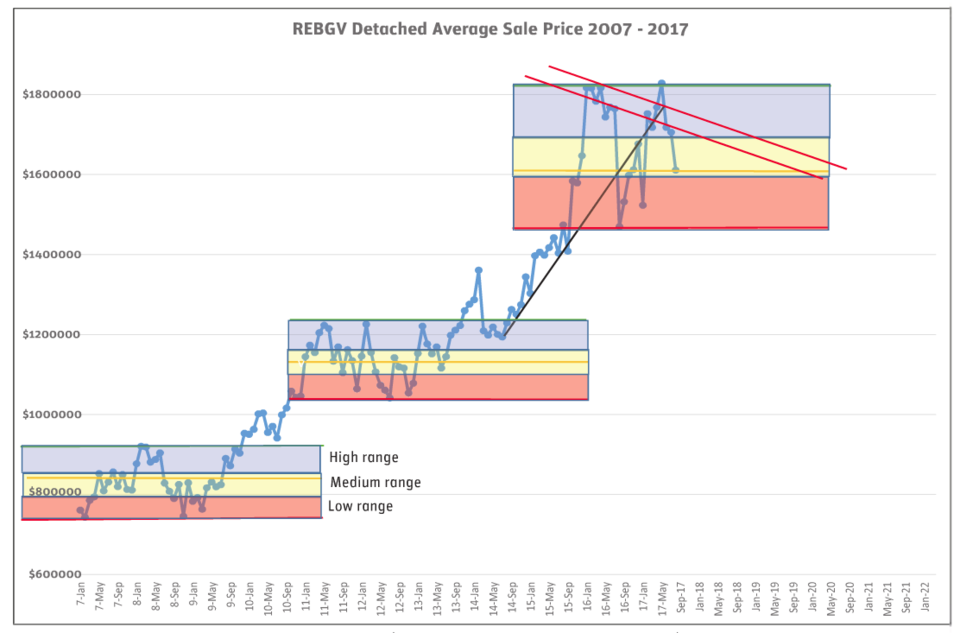
His call is for the average detached-house price to fall from the recent peak of $1.8 million to $1.48 million to $1.5 million in the latter half of 2019. Prices will remain in that range for two years before bottoming in 2021.
Eitel concentrated on detached housing because it does not have the supply swings common to the condominium or townhouse sectors. “It all starts with detached houses,” he said.
By looking at 40 years of Greater Vancouver detached-house sales and average price cycles, Eitel is confident that a trading pattern is established that will play out over the next five to seven years.
He noted that the last long-term cycle began in October 1987 and ran to 1996, during which time average house prices increased 190 per cent and peaked at $286,000 in February 1995. The average price then dropped 19 per cent to bottom out in December 1996.
Prices did not recover to the earlier price peak until November 2002, six years later.
We are seeing a similar pattern today, Eitel said.
“The current Vancouver detached-housing market has been on a long term uptrend line established during the 2008-09 recession,” he said. “We have tested this long term uptrend line six times since its inception in November 2008, which was the bottom of that cycle. At that time the average sale price was $750,686. In each of the six instances, the line has held true and propelled the market higher.
“This time, however, we will be seeing a similar event as during the 1990s, with a growth percentage of 144 per cent over the uptrend, which started from the low point in November 2008 and topped out in May 2017. By 2019 we will be on another collision course with two divergent trends converging on middle ground of the trading range to see which one will win out. This time we do have such downtrend occurrence positioning itself, eerily similar to the ‘90s. The time is upcoming for another long-term [downward] trend of more inventory, less volatility and lower average sale prices,” he explained.
Eitel claims that residential investors can use technical charting to successfully time the market.
“From all data collected from the Real Estate Board of Greater Vancouver [REBGV] dating from January 1977, the real estate market has acted in a predictable manner. This has not been noticed to date as a prevalent factor in the real estate community. Equity markets have been using technical charting all over the world on a daily basis. While this may come as a shocking revelation to some in the real estate community, the fact remains that technical charting works.”
Eitel noted that his theory of technical forecasting dates back to Charles Dow, who founded both the Wall Street Journal and the Dow Jones industrial average more than 100 years ago. Dow, Eitel said, proved that “history repeats itself and human psychology for buying and selling in a marketplace could be prognosticated using technical analysis.”
POLITICAL FACTOR
Eitel said that current conditions mirror the 1990s in that the Greater Vancouver housing market is also at the peak of a 10-year price growth cycle with similar price increases, and the political environment is also similar.
“The last time we had a Liberal prime minister and an NDP premier in B.C. was from November 1993 when Jean Chretien was elected and the NDP’s Michael Harcourt was already in power, since November 1991. The average detached sale price in November 1993 was $347,300. The two parties remained in power until June of 2001. The total price growth of the Greater Vancouver detached market during that period of time was 6 per cent,” he said.
“I do expect the market to come off from its highs and sell in the lower half of the trading range starting late in 2019 and lasting for years. However, I also firmly believe in Vancouver’s property values long term. At any time, you can buy a detached house and 10 years later that property will be worth more.”
CURRENT CONDITIONS
Sales of Greater Vancouver detached houses in August 2017 reached 901 units, a 26 per cent increase from the 715 detached sales recorded in August 2016. The benchmark price for detached properties as of August was $1,615,100. This represents a 2.2 per cent increase from August 2016 and a 0.2 per cent increase compared with July 2017, reports the REBGV.
This appears to challenge Eitel’s forecast of falling sales and higher inventory leading to a prolonged decline in detached house prices.
However, Eitel explains that the board uses benchmark prices, not average prices. He contends average prices provide a more accurate reading of real market conditions. He says that average Greater Vancouver house prices peaked in May 2017 at $1.8 million, and have been declining ever since.
Eitel also notes that the REBGV reports that total sales of detached houses in Greater Vancouver have fallen 33 per cent in the first eight months of this year compared with 2016, to 8,268 units. In three municipalities, benchmark prices are lower now than a year ago.
His advice to speculators: sell now and begin buying back into the Greater Vancouver detached housing market in the fourth quarter of 2021, which will be the bottom of the market. The breakout will begin then with a new price peak reached in mid-2023, Eitel contends.