
Random facts and stats about Vancouver’s housing market.
That’s what I’m bringing you today in this space after spending an inordinate amount of time going through the city’s Housing Vancouver progress report and data book.
Many of us media types have done some reporting about the mountain of information released April 2, and the fact the city approved 15,406 housing units over the past two years.
But there’s so much more to tell.
To set this up, just a reminder the city’s goal is to approve the construction of 72,000 new homes by 2027. The city says nearly 50 per cent will serve households earning less than $80,000 per year.
Two-thirds will be available for renters, with 40 per cent built with two or three bedrooms; "family-sized” is how the city describes those homes.
My purpose here is not to repeat what I already reported about where the city has made progress (condos, social and supportive housing, laneway homes) and not made progress (purpose-built rental housing, townhouses).
These are simply some random facts and stats cobbled together from the city’s housing report—which came via census, surveys, real estate sales and other sources—that you might find interesting, including which Vancouver homeowners no longer pay a mortgage (or maybe never did).
So let’s start there…
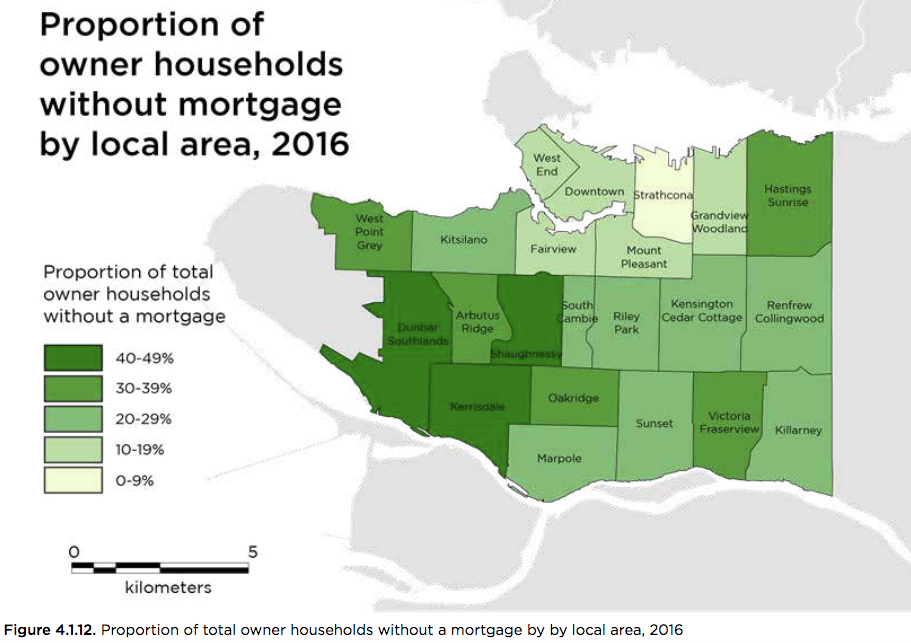
- In 2016, Shaughnessy, Dunbar Southlands, and Kerrisdale had the highest proportion of owner households without a mortgage relative to total owner households.
- Strathcona had the highest proportion of owner households with a mortgage relative to total owner households in the area.
- The median annual household income in Vancouver in 2015 was $65,421. In Toronto, it was $65,829 and in Montreal it was $50,227.
- In 2015, average household incomes were highest in some of the city’s west side neighbourhoods, with annual household incomes of $262,760 in Shaughnessy, $178,415 in Dunbar-Southlands, $161,576 in West Point Grey and $159,945 in Kerrisdale.
- In 2015, Strathcona had the lowest household average ($46,368) and median incomes ($21,964).
- In 2016, approximately 44 per cent of ownership households resided in apartment buildings.
- Over the past 10 years, condominiums have represented the majority of ownership housing starts in Vancouver and the region.
- Over the same period, the city approved 8,680 purpose-built market rental units secured as rental housing for the life of the building,
- The three local areas with the largest share of purpose-built rental approvals in 2018 were downtown (19 per cent), Kensington-Cedar Cottage (19 per cent) and Fairview (15 per cent).
- The number of residential properties owned by non-residents in Vancouver decreased from 14,310 to 14,055 from 2017 to 2018, despite an overall increase in the number of residential properties.
- In 2018, Vancouver issued a total of 709 laneway house permits, the highest level since the creation of the program in 2009.
- The city aims to end street homelessness, and reduce the share of Indigenous people experiencing homelessness by 50 per cent by 2022.
- Grandview-Woodland holds 44 per cent of the Indigenous society owned/operated non-market housing stock in Vancouver. Grandview-Woodland also has the highest share of Indigenous residents in Vancouver.
- From 2017 to 2018, the total homeless population--2,181--increased slightly, and the share of the city’s homeless population reporting Indigenous identity increased from 39 to 40 per cent.
- As of Dec. 31, 2018, the city approved a total of 4,511 condominium apartments and 86 townhouse units. Of the condo units approved in 2018, 50 per cent (2,254 units) were family units consisting of two and three bedrooms.
- Downtown had the largest share of condominium approvals in 2018 (57 per cent) due to the significant volume of units approved on the Plaza of Nations and BC Place sites. Riley Park had the largest share of townhouse approvals in 2018 (38 per cent).
- The City of Vancouver operates 11 buildings with 816 social housing units. A total of 224 buildings with 11,421 co-op, social, and supportive housing units (43 per cent of the stock) are located on city-owned land.
- In 2018, a total of 931 social and supportive housing units opened. Of these units, 527 were permanent social and supportive housing units and 404 were temporary modular homes.
- Since 1994 the private single-room-occupancy hotel stock has decreased by almost half, from 7,830 units in 1994 to 4,102 in 2017.
- Overall, there are 131,000 market rental dwellings in the city
- Approximately 18 per cent of the total purpose-built rental stock (10,390 units) in Vancouver consists of family-sized units (17 per cent are two-bedroom and one per cent are three-bedroom units).
- Between 2006 and 2016, the city’s population increased by more than 50,000 residents. Metro Vancouver’s overall population increased by nearly 350,000 residents in the same 10-year period.
- In 2016, the local areas with the highest count of total renter households were the West End, Downtown, Kitsilano, Fairview and Mount Pleasant.
@Howellings


