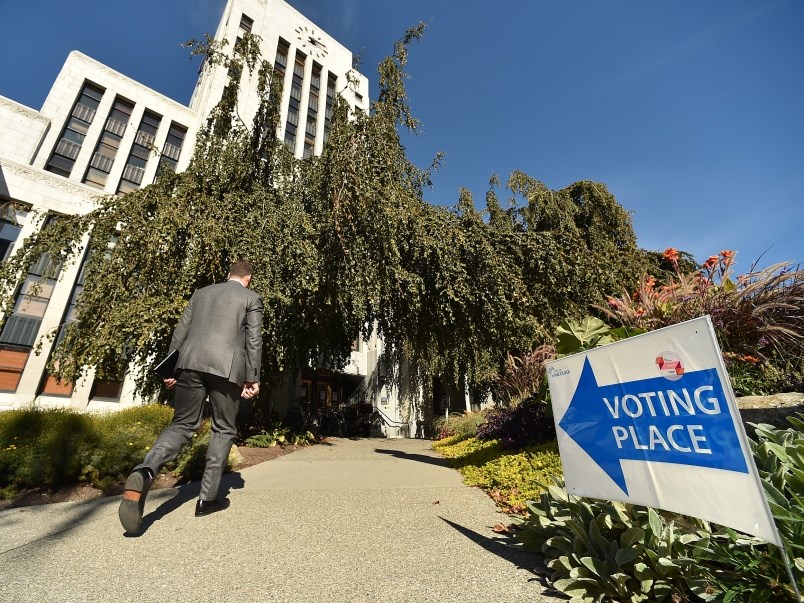
Some disappointing and interesting news to report on last fall’s civic election in Vancouver…
First, let’s begin with how much it cost: $4.1 million, which is $1.2 million more than the vote in 2014.
About $1.8 million of that was on staffing (including training), another $1.1 million on communications (outreach and postage) and $1 million on technology.
These figures are in a city report that goes before city council next week.
The report includes a survey of 2,038 people (1,417 voters and 621 non-voters) that was conducted as people left the polls on voting day and in the days and weeks following the Oct. 20 vote.
Which brings me to the disappointing news—as if a 39.4 per cent voter turnout, which was lower than the 43.4 per cent in 2014, wasn’t enough to send democracy types into a civic heart of darkness.
In no particular order, let’s all share in the disappointment:
- Twenty-nine per cent of respondents said they didn’t know enough about the candidates, so they didn’t vote.
- Twenty-two per cent said they didn’t know enough about the campaign issues.
- Twenty per cent said there were too many candidates.
- Thirteen per cent said they didn’t have time to vote, that casting a ballot didn’t fit into their schedule or they were out of town.
- Eleven per cent said they were not interested or concerned about campaign topics. The same percentage said they didn’t feel like their vote would make a difference.
- Ten per cent said they have a “general dislike” of politics and didn’t like the candidates.
The list goes on and it gets more disappointing, including respondents saying they didn’t know how or where to vote and that bad weather was another reason for not voting.
Bad weather?
I recall a relatively warm night and no precipitation, particularly in an East Side park while drinking beer with colleagues after we filed our stories.
Some of you voters reading these excuses of non-voters have likely set your hair on fire by now. Some have also probably wondered how someone could take the time to answer a survey, but not take the time to vote.
The fact is the city has made a concerted effort to get more people to the polls, offering several days of advance voting opportunities, offering a “vote by mail” option and allowing voters to cast a ballot at any polling station.
There was even “curbside voting” for those voters with a disability or illness, which allowed people to vote in a car outside a polling station.
Tonnes of advertising (in newspapers, on buses, on the jumbotron at B.C. Place), a voters’ guide (in four languages), distributing voter information cards, social media campaigns, reaching out to marginalized people and beefing up the city’s election website were other initiatives in play last fall.
Candidate names placed in random order on the ballot was another move, as was the provincial government’s long-awaited decision to ban union and corporate donations to candidates and parties.
Still, a majority of eligible voters didn’t seem to care enough to vote.
Anyway, here’s some interesting news that may or may not disappoint. That, I suspect, depends on where you live, the language you speak, your age, your education level and the colour of your skin.
Here you go:
- Voters tend to be older and significantly more likely to live in southwest and northeast Vancouver, and to have been Canadian citizens for 20 years or more (if not born in Canada).
- Voters are significantly more likely than non-voters to be male and to be homeowners. They are less likely to be young singles.
- Voters are significantly more likely to have a degree than non-voters and to be employed full-time, self-employed or retired.
- Caucasian Vancouverites are significantly more likely to be voters, while visible minority groups are significantly less likely to be voters.
- Voters tend to have a higher household income than non-voters.
The most interesting news of all, he said selfishly as he was searching for a way to close out this random list and end this piece, is that “news articles were the most common sources relied on for election information.”
Now that’s some good news to end on.
Fist bumps all around to my journo colleagues.
The next election is in 2022.
@Howellings


