
I can’t ever recall being described as a municipal government nerd.
An enthusiast — yes.
But never a nerd.
That description may change after I complete this courageous and daring piece of public service journalism about the world of data sets, maps and charts.
Got a brief tutorial recently from a couple of city hall computer brainiacs on the new “open data portal” on the City of Vancouver’s website.
It’s more exciting and useful than it sounds.
Here’s why…
Say you want to take your bike out for a spin and check out the city’s public art. And say you want to stop along the way at one of the city’s drinking fountains and then, sometime later, are desperate to find a public washroom.
Well, you can build a map with all of that info on it — the bikeways, the public art, the drinking fountains and the public washrooms. It’s only a few clicks away on the city’s website at Vancouver.ca
Let’s give it a try…
First, if you're more capable at navigating the website than others, and want to bypass some steps, simply click here.
For others, go to the website, type in “open data portal” in the search bar. You’ll come to a page that says “open data.” Click on that to bring you to the open data page.
See the blue coloured “view the portal” icon?
Click on that and prepare to have your life changed.
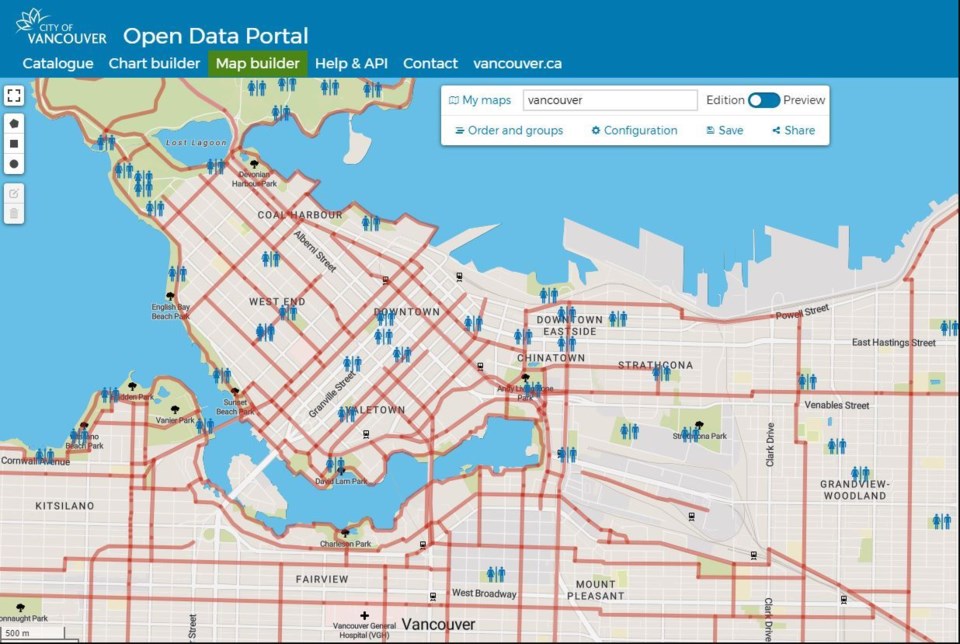
So far, I’m a fan of the map builder tool. Click on it and then type your map name as “Vancouver.” Look to the right of the page to “add a dataset to this map” icon.
For this exercise, I chose bikeways, public art, drinking fountains and public washrooms. After selecting the datasets, they automatically load on to the map of Vancouver.
And voila — your own map tailored to your bike journey.
I chose to only include the bike routes (in red) and public washrooms (blue icons) in the map I produced to run with this piece. Adding the other datasets made for a busy map, but online it’s very interactive, allowing you to zoom in to neighbourhoods for more detail.
The city says there are more than 160 public datasets to choose from, including the location of electric vehicle charging stations, off-leash dog parks and homeless shelters.
Other choices include snow removal routes, heritage sites, city-owned properties, business licences, parking tickets, motorcycle parking, libraries, street lighting poles, sewer manholes, wayfinding map stands… the list goes on.
You can also find out who is buried in Mountain View cemetery by clicking on the “Mountain View cemetery burial index.” It gives the person’s name, age and date they were buried.
With all of this, you can filter the data and select a big or small number of records in your search.
For example, I added the dataset “rental standards – current issues” to a map. This is helpful if you’re looking to see if a building has any maintenance, health or safety issues.
I was able to see up to 400 records listed by name.
I randomly clicked on Central City Foundation and was brought to a page that showed the property it owns — Abbott Mansions at 404 Abbott St. — has resolved 14 “issues” and has one outstanding “issue.”
The issues were related to the city’s standards of maintenance bylaw, including violations related to roofing, fire escapes, plumbing, walls and ceilings.
The city’s rental standards database has been available for some time on the website, but the portal plots properties on a map. You can also choose by neighbourhood and do a lot of other funky stuff my tech-challenged brain doesn’t fully comprehend.
For people who like charts, a chart builder tool is available in the portal.
I clicked on the “non-market housing” dataset and chose to build a column chart. Pie charts, bar charts and even a “spider web chart” are other options to present the data.
Interestingly, during my clicking exercise, I was somehow transported to another data portal that allowed me to search through a mountain of data from around the world.
I was able to source the number of CCTV cameras in Leicester City (492, if I read it correctly), view the aggregated data about fires detected by NASA satellites in orbit from 2017 to 2019 (more than nine million records) and bicycle crashes in Chapel Hill, North Carolina (165 records).
The portal, as you can see, has way more functions than I’ve presented here — whether you’re interested in local stuff or what’s going on in the rest of the world.
So if you didn’t follow along with my rudimentary tutorial, take some time to check out the city’s portal.
I mean c’mon, who doesn’t want to look at Goad’s Fire Insurance Map of 1912 for Vancouver?
Which, according to the descriptor in the portal, “shows the location, building materials and footprint of buildings, the original water line where it differs from the 1912 shoreline, some proposed developments, electoral wards, legal land descriptions, lot sizes, street and lane widths and old street names that had been recently changed.”
Go ahead, nerd out.
Or, if you were born in the 1960s and continue to grieve the loss of your Smith Corona typewriter, go back to whatever you were doing before you bothered to read this.
Good luck, either way.
@Howellings


